The goal of this page is to keep track of our visualizations of John Hattie’s effect size list based on the Visible Learning research. John Hattie constantly updates his list.
The first Visible Learning ranking is from 2009 and contains 138 effects published in “Visible Learning”. The second list with 150 effects was published in “Visible Learning for Teachers”. An updated list of 195 effects was published in 2015 in Hattie’s paper “The Applicability of Visible Learning to Higher Education”. More recent updates were published online on visiblelearningplus.com.
The Visible Learning research is now based on 1400 meta-analyses – up from 800 meta-studies in “Visible Learning” (2009). According to Hattie the story underlying the data has hardly changed over time even though some effect sizes were updated and we have some new entries to the list.
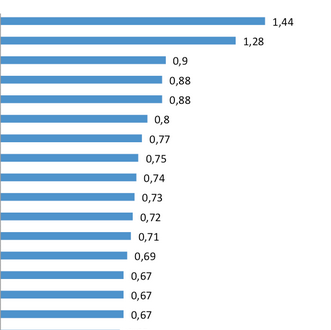
Below you can find a backup of our comparative visualization of the rankings from 2009, 2011, and 2015. It includes 195 influences and effect sizes related to student achievement. Another backup of our first visualisation of the Visible Learning ranking is linked here. This includes the original image that has been shared widely over the internet and on social networks. Click here to see an updated versions of the Hattie ranking.
You can compare the entries from Visible Learning (red), Visible Learning for Teachers (green) and Hattie 2015 (blue).
Hattie Ranking of Effect Sizes
Click on the image for an interactive visualization of the effect size lists.

Diagram by Sebastian Waack, founder of Edkimo.
Follow me on Twitter. Always happy to talk!


