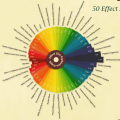
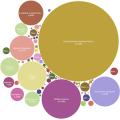
Visible Learning visualized in a beautiful infographic

Terry Burr designed that beautiful educational infographic for Osiris Educational and Visible Learning Plus. The infographic is based on data from John Hattie’s research and the work of the Visible Learning Plus team.

(c) www.osiriseducational.co.uk / www.visiblelearningplus.co.uk

Educational Infographic for Osiris Educational and Visible Learning with John Hattie


Tagged with:
Posted in Infographic, Infographics, Visible Learning
5 comments on “Visible Learning visualized in a beautiful infographic
  1. Darrell says:

    Is there a way to purchse your infographic posters??
    For example; How to have an effect on student achievement. Top 7 and Bottom 7 with the colorful cirlce of all the levels of achievement.

  2. Rachel Schrimsher says:

    Is there a way to get this infographic ordered for my classroom?

  3. Sarah says:

    Why were these “top” and “bottom” 7 chosen? These are not the effects with the highest and lowest effects sizes, respectively. For instance, Piagetian programs are rated quite high, far larger effect size than parental involvement and cooperative learning [both of which are substantially lower than the highest 7 effect sizes]. Things like study skills and teacher-student relationships are not mentioned despite both being higher effect sizes than parental involvement and cooperative learning. On the bottom side, most of the lowest are not listed: TV, retention, student control over learning, teacher subject matter knowledge…among others. Principal/leadership is FAR greater than the lowest 7 [as is homework]. I do not understand why these particular 14 were chosen? what is the methodology, because the numbers do NOT support these choices.

8 other websites write about for "Visible Learning visualized in a beautiful infographic"
  1. […] Visible Learning visualized in a beautiful infographic | Visible Learning […]

  2. […] Visible Learning visualized in a beautiful infographic | Visible Learning […]

  3. […] Terry Burr designed that beautiful educational infographic for Osiris Educational and Visible Learning Plus. The infographic is based on data from John Hattie’s research and the work of the Visible Learning Plus team.  […]

  4. […] is something that can benefit all students. Parental engagement works. It is one of Hattie’s top seven effects on student learning , most parents have been shown to want to get more involved. I think that in Thailand, the culture […]

  5. […] Terry Burr designed that beautiful educational infographic for Osiris Educational and Visible Learning Plus. The infographic is based on data from John Hattie’s research and the work of the Visible Learning Plus team. (c) http://www.osiriseducational.co.uk / http://www.visiblelearningplus.co.uk Visible Learning Infografik Visible…Read more ›  […]

  6. […] working together. However, we want them to work together! Design for collaboration. According to John Hattie’s research, cooperative learning is in the top 7 for effects on student achievement. Collaboration does not […]

Leave a Reply

Your email address will not be published. Required fields are marked *

*

CAPTCHA Code *

Online-Feedback

Edkimo Online-feedback. Try it now, it's free!

About Visible Learning
Visible Learning means an enhanced role for teachers as they become evaluators of their own teaching. Visible Teaching and Learning occurs when teachers see learning through the eyes of students and help them become their own teachers.
Weblinks


Visible Learning plus is a professional development programme for teachers. It provides an in-depth review and change model for schools based on John Hattie's research. With a seminar and support series the Visible Learning plus team helps schools to find out about the impact they are having on student achievement. www.visiblelearningplus.com