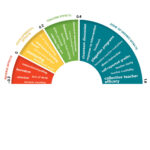
Throughout his Visible Learning journey John Hattie has used the “barometer” to visualize the effect size of an influence on student achievement. It has also also been on the cover of several Visible Learning books. The barometer scale is divided…
Throughout his Visible Learning journey John Hattie has used the “barometer” to visualize the effect size of an influence on student achievement. It has also also been on the cover of several Visible Learning books. The barometer scale is divided…
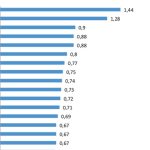
The goal of this page is to keep track of our visualizations of the effect size list based on the Visible Learning research. John Hattie constantly updates his list. He has first published 138 effects in Hattie (2009) “Visible Learning”, then 150 effects in Hattie…
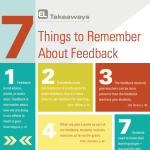
“Most of the feedback that students receive about their classroom work is from other students – and much of that feedback is wrong.” (John Hattie) The Association for Supervision and Curriculum Development (ASCD) is an international non-profit organization for teachers…
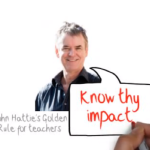
In Visible Learning for Teachers (p. 159 ff) John Hattie claims that “the major argument in this book underlying powerful impacts in our schools relates to how we think! It is a set of mind frames that underpin our every action and…
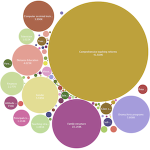
John Hattie has synthesized more than 800 meta-studies related to achievement. In his book Visible Learning he found 138 influences with positive and negative effects on learning outcomes. Some of Hattie’s critics state that comparing so many different things would…
John Hattie: Visible Learning | Infographics Visible Learning visualized in a beautiful infographic Feedback for Learning – Infographic Visible Learning: 800+ Meta Studies And 138 Effects Visualized Visible Learning For Teachers
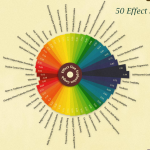
Terry Burr designed that beautiful educational infographic for Osiris Educational and Visible Learning Plus. The infographic is based on data from John Hattie’s research and the work of the Visible Learning Plus team. (c) www.osiriseducational.co.uk / www.visiblelearningplus.co.uk Visible Learning Infografik Visible…